Read a Profit Curve for Feasibility and Fragility
Interpreting What the Analysis Is Actually Telling You
Profit analytics produces curves, numbers, and apparent “answers.”
This toolkit teaches you how to read those outputs without mistaking them for conclusions.
It does not compute profit.
It does not optimize profit.
It does not predict outcomes.
Instead, it helps you answer a prior and more fundamental question:
What kind of decision is this, given what the profit curve actually shows?
Before asking what to do, you must first understand what you are seeing.
What This Toolkit Is (and Is Not)
This toolkit teaches recognition, not action.
It helps you learn to see:
- when profit is impossible,
- when profit exists but is fragile,
- and when profit appears robust enough to justify commitment.
It does not tell you:
- which price to choose,
- whether to proceed,
- or what experiment to run next.
Those decisions come later.
If you skip this interpretive step, everything that follows—optimization, sensitivity analysis, even intuition—rests on a misreading of the situation.
A Profit Curve Is a Map, Not a Verdict
A profit curve shows profit as a function of price, given:
- a demand curve learned from evidence,
- a cost structure defined by commitments,
- and a scale assumption made explicit.
It is a conditional object.
Every point on the curve answers the same conditional question:
If demand behaves like this,
and costs are structured like this,
and if scale is what we’ve assumed,
then profit would look like this.
That is all it claims.
A profit curve does not:
- assert that any price will be chosen,
- guarantee that demand will materialize,
- or validate the venture as “good” or “bad.”
Like any map, it simplifies reality in order to make structure visible.
What You’ll See in the App
The Profit Analytics app visualizes profit as a function of price.
This toolkit assumes you are looking at a profit curve that looks like this.
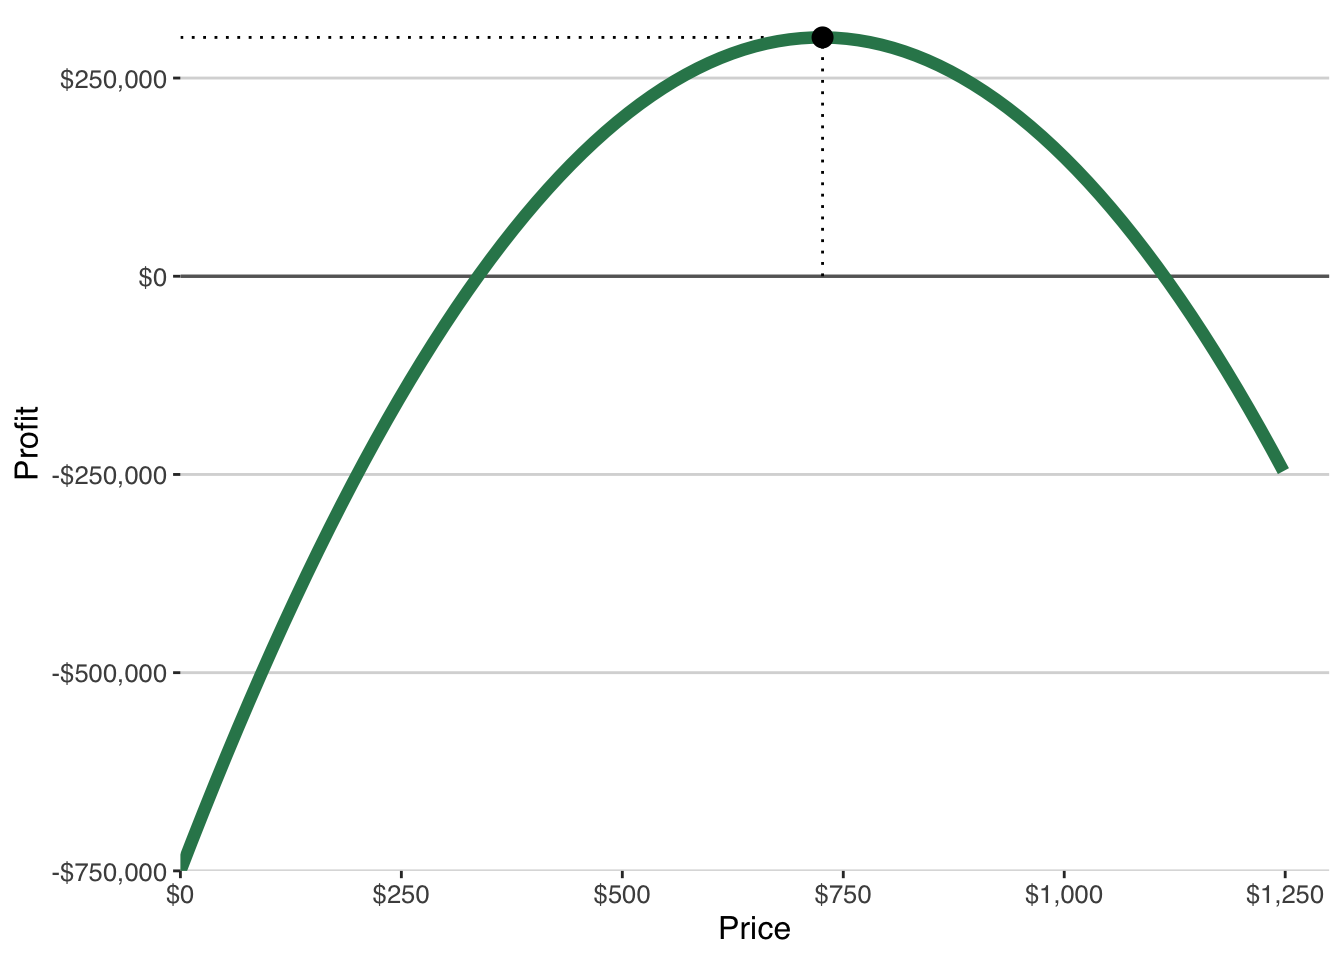
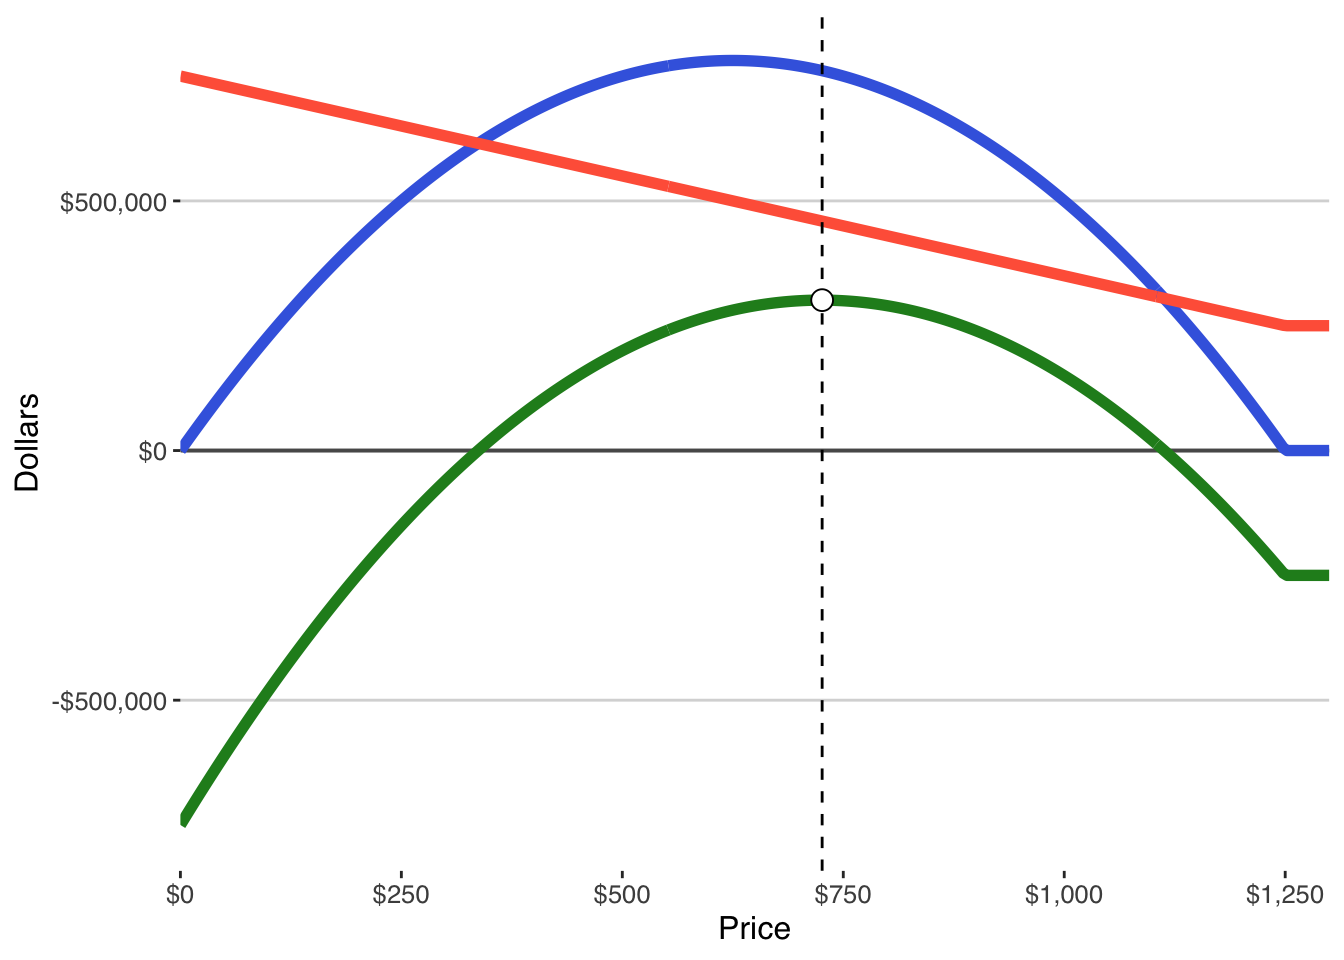
“The app also shows revenue and cost curves, but this toolkit is focused on the profit curve because it is the decision object. In the sections below, you’ll learn to classify the curve first (impossible / fragile / robust) before you worry about what to change.”
The First Question to Ask: Is Profit Even Possible?
Before looking for a “best” price, ask a simpler question:
Does the profit curve ever cross zero?
This divides all outcomes into two fundamentally different cases:
Profit is impossible
Profit is negative at every price.Profit is possible
Profit becomes positive at least somewhere on the curve.
Everything else in this toolkit builds on that distinction.
If profit is impossible, optimization is meaningless.
If profit is possible, interpretation still matters.
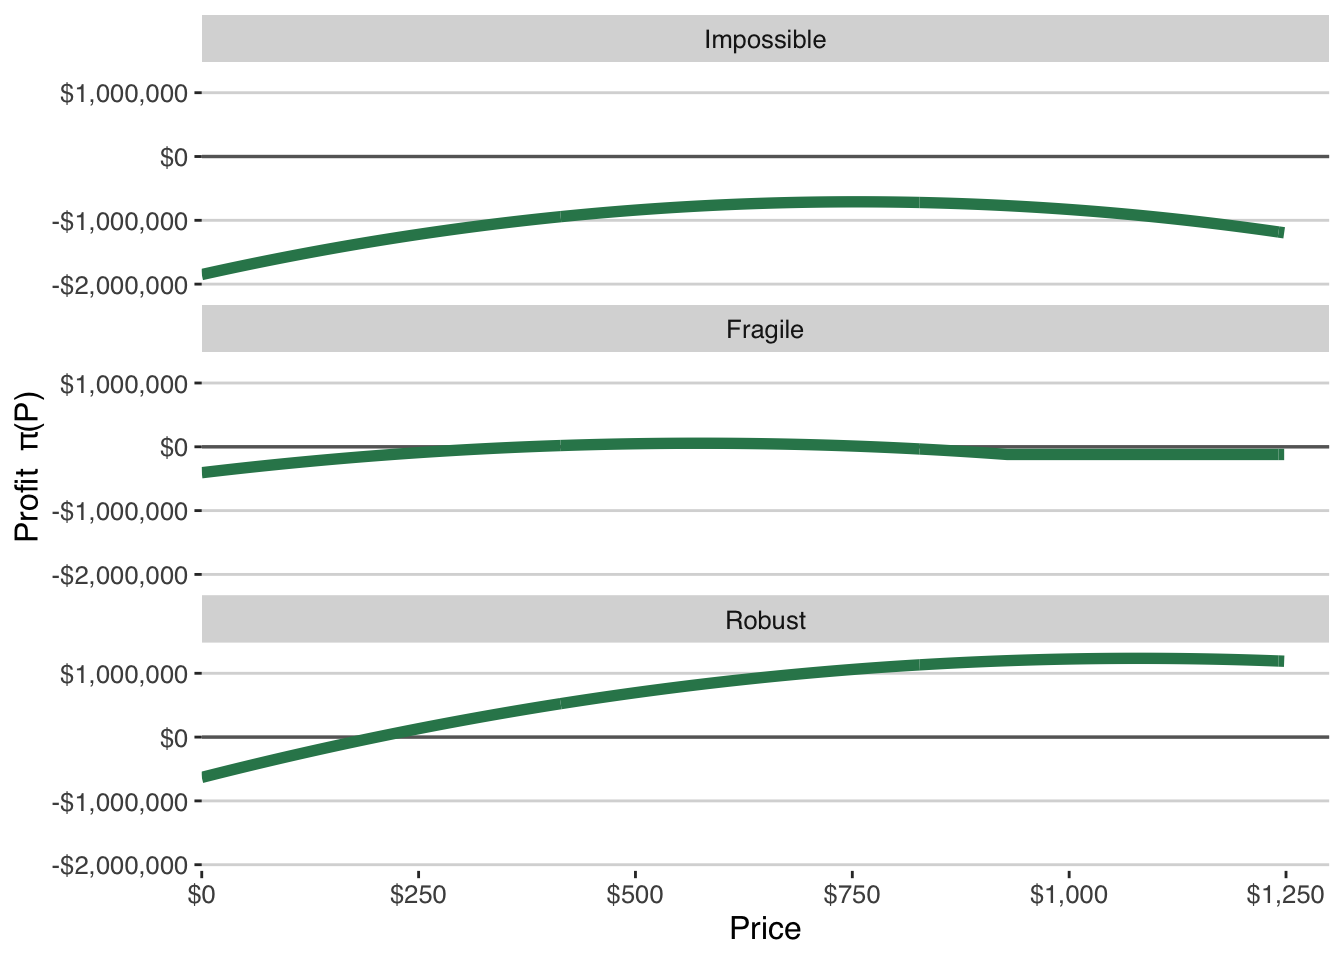
Case 1: When Profit Is Impossible
Profit is impossible when the curve never rises above zero.
This is not an error.
It is a diagnosis.
It means:
Given the current assumptions about demand, cost, and scale,
there is no price at which this design can support its commitments.
This result is often emotionally jarring, especially for entrepreneurs who have invested time, energy, or identity into the idea.
But analytically, it is one of the most valuable outcomes profit reasoning can produce.
Impossible profit typically arises from one of two structural problems:
Negative margins
Revenue never exceeds variable cost. Selling more only deepens losses.Unsupportable fixed costs
Contribution exists, but scaled demand cannot support the commitments being assumed.
Importantly, “weak demand” does not appear as a separate case.
Weak demand matters only insofar as it fails to clear costs or scale.
If profit is impossible, the correct response is not to search for a better price.
The correct response is to ask:
- Which assumption is doing the damage?
- What would need to change for profit to become possible?
- Are those changes within our control—or even desirable?
Sometimes the answer is redesign.
Sometimes it is delay.
Sometimes it is to stop.
None of those outcomes represent analytical failure.
Case 2: When Profit Exists but Is Fragile
When the profit curve crosses zero, the immediate reaction is often relief.
There is at least one price at which the venture appears viable.
But this relief is often premature.
Profit that exists somewhere is not the same as profit that can support commitment.
What Fragile Profit Means
Profit is fragile when it depends on:
- a very narrow range of prices,
- highly specific demand assumptions,
- precise execution with little room for error,
- or optimistic beliefs about scale and access.
In these cases, profit is technically possible—but structurally exposed.
Fragile profit is not rare.
It is the most common outcome in early entrepreneurial analysis.
Two Common Forms of Fragility
Fragile profit typically appears in one of two visual patterns.
1. Thin Demand, Low Commitments
In this case:
- variable and fixed costs are relatively low,
- demand exists but is shallow,
- profit is positive only within a narrow price window.
A small change in price, competition, or customer behavior pushes profit back below zero.
The venture survives only if many things go right at once.
2. Strong Demand, Heavy Commitments
In this case:
- contribution margins are positive,
- demand appears strong at scale,
- but fixed costs are large.
Profit exists only if demand materializes at or above the assumed scale.
Any shortfall quickly erases surplus.
These two cases look different, but they share the same logic:
The decision works only if error is small.
Why Fragile Profit Is More Dangerous Than Impossible Profit
Impossible profit is clear.
It tells you the design does not work as structured.
Fragile profit is deceptive.
Because profit exists somewhere, it invites
- confidence precisely where caution is warranted,
- selective attention to favorable assumptions,
- and pressure to “optimize” rather than rethink.
This is where entrepreneurs are most likely to mistake analytics for validation.
A thin positive region on the curve can feel like permission—when it is actually a warning.
The Key Distinction: Sign vs. Sensitivity
At this stage, the most important question is not:
Is profit positive?
It is:
How sensitive is profit to being wrong?
Fragile profit is not defined by the sign of profit, but by its exposure to error.
When profit is fragile:
- small demand errors matter a lot,
- small cost overruns matter a lot,
- small scaling shortfalls matter a lot.
None of these errors are unusual.
Fragility fails not because entrepreneurs are careless, but because uncertainty is unavoidable.
Case 3: When Profit Appears Robust
Robust profit is not common—but it is distinctive.
A profit curve appears robust when:
- profit is positive across a wide range of prices,
- reasonable demand error does not reverse feasibility,
- cost overruns reduce profit but do not eliminate it,
- and scale assumptions can be missed without collapse.
This does not mean success is guaranteed.
It means the decision can survive being wrong.
What Robust Profit Does—and Does Not—Mean
Robust profit does not mean:
- the business will dominate the market,
- competition will not respond,
- or execution will be easy.
It means something more modest and more important:
The economics of the design are strong enough to justify commitment despite uncertainty.
Robust profit widens the margin for learning.
It gives the venture time to adapt.
That is often the most valuable feature of all.
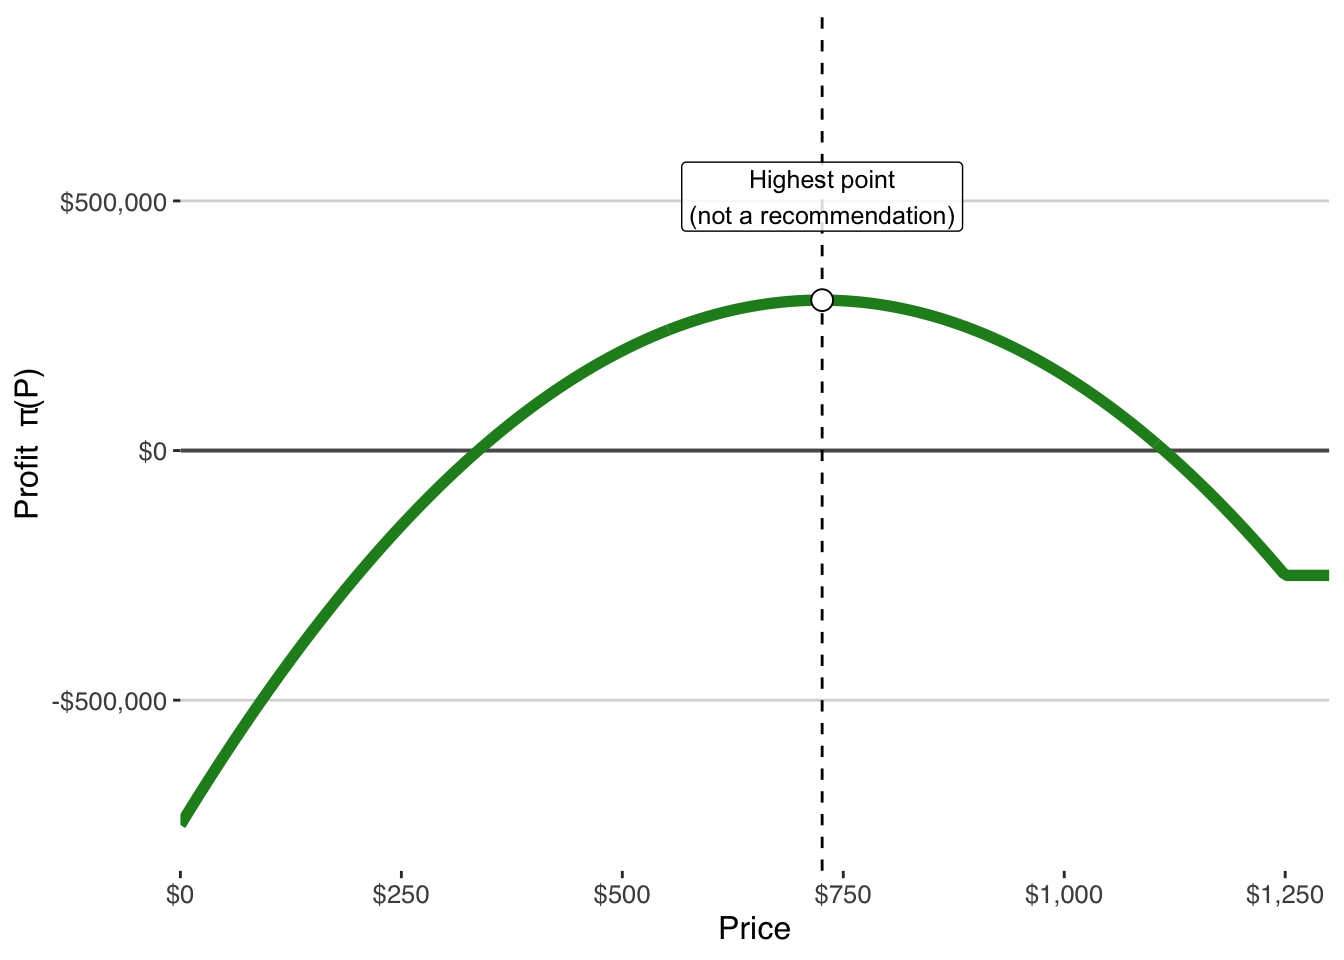
What Not to Do When Reading a Profit Curve
Before moving on, it is worth naming a few common misinterpretations.
Do not:
- treat the highest point on the curve as a recommendation,
- assume the curve predicts future outcomes,
- read precision into estimates that are inherently uncertain,
- or equate a positive region with validation.
A profit curve is an input to judgment, not a substitute for it.
What This Toolkit Deliberately Stops Short Of
This toolkit ends once you can correctly recognize:
- impossible profit,
- fragile profit,
- and robust profit.
It does not tell you:
- what to change,
- what to test next,
- or whether to proceed.
Those questions require a different move.
Once you can see fragility clearly, the next question becomes:
Which assumptions deserve attention before committing further?
That is the role of sensitivity—not as an optimization tool, but as a guide for learning and staging commitment.
The next toolkit begins exactly there.