3 What Demand Is (and Is Not)
A relationship between price and quantity, not a number and not a hope
Entrepreneurs talk about demand constantly.
We have strong demand. There’s no demand for that. Demand really took off after launch.
Listen closely and the word is doing different work each time. The first speaker means people seem interested. The second means nobody has bought one. The third means sales grew. Those are three different claims about three different things, and none of them is demand.
The confusion is expensive, because demand is the term you cannot choose and everything downstream is built on it. So this chapter does one job: get precise about the object before trying to measure it. No estimating yet, and no optimizing. Just a clear look at what you are hunting.
Why Demand Comes First
Almost every decision you care about sits downstream of demand. What to charge depends on how many you would sell at each price. Whether to buy the equipment depends on whether the volume covers it. Whether a cost structure works, whether growth can pay for itself, whether a competitor’s move should worry you: each of those is a question about quantity wearing different clothes.
Without demand these decisions are guesses with spreadsheets attached. With it they become judgment calls you can defend, which is a lower bar than certainty and a much higher one than confidence.
What Demand Is
Demand is a relationship between price and quantity. Not a single number, not a forecast, and not a line on a chart that goes up over time.
A demand curve answers one narrow question:
At each possible price, how many units would customers buy?
That question has two silent assumptions buried in it, and both will wreck your evidence if you leave them buried. What counts as one unit, and over what period. We come back to those in a moment, because they are where most surveys quietly go wrong.
Figure 3.1 shows a simple demand curve.
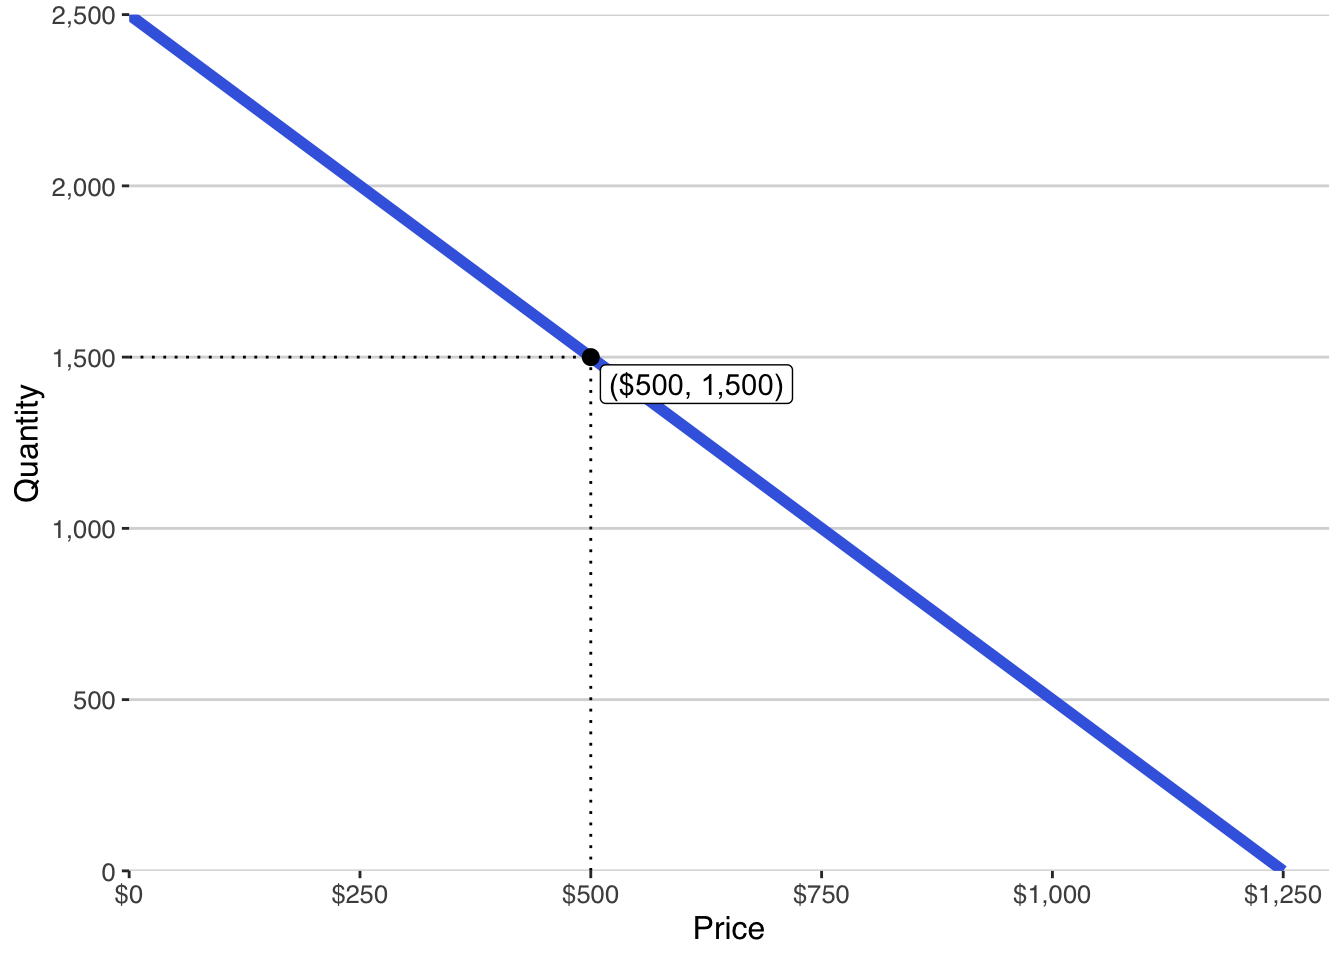
Price runs along the horizontal axis and quantity up the vertical one. Read the marked point and it says that at a price of $500, customers would buy 1,500 units.
Three things about that sentence repay attention. It describes variation rather than an outcome, so it is not telling you what will happen; it is telling you what would happen under a condition you have not yet chosen. It summarizes many possible worlds at once rather than the one you will end up in. And the curve itself is unknown to you, which is the entire difficulty. You do not pick a demand curve the way you pick a price. You go and find out what yours is.
What Counts as One Unit
Before anyone can tell you what they would pay, both of you have to agree on what they would be paying for. That sounds trivial. It is where a startling number of demand surveys die.
A unit is whatever the customer mentally counts when deciding whether to buy. That is a cognitive definition rather than an accounting one, and it may or may not match how you would like to sell.
Unit — whatever the customer mentally counts when deciding whether to buy, which need not be how you package it or invoice it.
Ask someone what they would pay for your prepared meals and watch the question fall apart. One dinner? A week of them? A month on subscription? A year? Those answers span two orders of magnitude, and a respondent who guesses wrong is not being careless. You asked an ambiguous question and they resolved the ambiguity however seemed natural, silently, without telling you which way they went.
The damage is worse than noise. Noise cancels; this does not. You end up with a column of numbers that look comparable and are answers to different questions, and nothing you do downstream can separate them again. The curve you fit will be perfectly smooth and describe nobody.
So pick the unit the customer already counts in. If they think in visits, do not ask about memberships. If they think in cases, do not ask about pallets. Where the natural unit and your preferred pricing differ, ask in theirs and convert afterward, because you can do arithmetic on a clear answer and you cannot rescue a muddy one.
Over What Period
The second silent assumption is time. Call it the decision period: the stretch over which a customer makes this choice and can make it again. It goes wrong in the opposite direction from the unit, because where an ambiguous unit produces scattered answers, an unstated period produces answers that agree with each other and mean nothing.
Decision period — the span of time a quantity refers to. Quantity means nothing without one, and every cost you set against it has to use the same span.
Every purchase decision sits in a rhythm. Some are once in a lifetime, some are monthly, some are whenever the old one breaks. A customer who would pay $40 is telling you something entirely different depending on whether that is $40 once, $40 a month, or $40 every few years when they think of it.
The characteristic failure is optimistic and easy to miss. You gather willingness to pay for a purchase people make roughly once, then quietly multiply by twelve because your cost model runs in months. Every number in the calculation is real and the answer is fiction.
Name the period the way the customer experiences it rather than the way your spreadsheet wants it. If people buy when something wears out, the period is the wear-out interval, whatever your fiscal calendar says. Then hold that period fixed through everything that follows, because the quantity you estimate, the costs you compare it against, and the profit you compute all have to be measured over the same stretch of time or the comparison is meaningless.
How to Read a Demand Curve, Once
For anyone without economics training, one explicit pass at what this picture does and does not mean is worth the time.
The curve is a map rather than a timeline. Nothing on it is happening in sequence, and moving along it does not mean time is passing or a decision has been taken. It shows how quantity would change if the price were different, which is a claim about a set of hypothetical worlds rather than a prediction about the actual one.
It is also not something you optimize directly. The curve is a fact about your customers that you are trying to discover. What you optimize is your position on it, and that comes later, once you know roughly where it runs.
What Demand Is Not
Four things get mistaken for demand often enough to name.
Interest. Would you try this? and do you like the idea? are pleasant questions that generate pleasant answers. Neither mentions money. Without a price there is no demand, only curiosity, and curiosity has never covered a fixed cost.
Adoption. Adoption counts who has started using something. It is an outcome you observe after the fact, where demand is a relationship you estimate before it. A product can be widely adopted and priced below what it costs to deliver.
Usage. Usage measures how much people consume once they have bought. Heavy usage is genuinely good news about retention and tells you very little about what anyone would have paid at the moment of deciding.
Revenue. Revenue is price times quantity, one number produced by one point on the curve. Demand is the whole curve, which is why revenue can rise while your economics get worse and why chasing the first without understanding the second is how ventures grow into trouble.
Changes Along a Curve, and Changes in the Curve
One more distinction is worth seeing early, because the two situations it separates produce identical-looking disappointment and call for opposite responses.
Below is the same curve you just met, with handles on it.
Move the price slider first. The dot travels up and down a curve that does not move. Sales fell because you raised your price, and nothing at all changed about your customers. Drop the price back and the volume returns, because it was waiting there the whole time.
Now put price back where it was and move the market size slider instead. The dot moves again, and this time for a completely different reason: the whole curve has shifted, and the dashed line marks where it used to sit. Sales fell at a price you never touched. Something changed out in the world, and lowering your price will not restore what you lost. It will only make the loss cheaper.
The second case is the one that matters, because a simple model like this puts everything that is not price into a single number, the intercept. How many people there are, what a rival is charging, whether the season turned, whether anyone has heard of you: all of it lands in one place, and moving it moves the whole curve rather than your position on it.
That distinction is worth the trouble because the two look identical on a sales report. Revenue is down, and that is the entire content of the report. Whether the fix is a price change or something else altogether depends on which of these happened, and the report cannot tell you.
Economics has formal names for this pair. What matters here is that you can tell which one you are in.
Putting It to Work
Ask yourself — what is one, and over what period?
Write out the sentence a customer would actually be answering: What is the most you would pay per ______, per ______?
Note the shape of that question before you fill it in. It asks for a maximum rather than a verdict on a price you name. Would you pay forty dollars? answered yes tells you only that this person sits somewhere above forty, and you never find out where. The most-you-would-pay version returns the point at which that person’s own quantity moves from zero to one, which is the raw material a demand curve is built from. Price-testing questions have their place later, once you have a curve and a candidate price worth testing.
Now fill in the two blanks for your own venture. Most people hesitate on the unit and discover they have never once stated the period.
Now read it aloud as though you were the customer rather than the founder. If you would need to ask a clarifying question before you could answer, so will they, and they will not ask. They will guess, silently, and hand you a number that means something other than what you record.
If the unit you chose is not the one your customer already counts in, write theirs down beside it. That is the one to ask in.
The move: Fix the unit and the period before you ask anybody anything. A willingness-to-pay figure with neither attached is not evidence, it is a number.
Knowing what demand is does not yet tell you how to see yours. Demand curves do not turn up on their own; they are built out of evidence that somebody had to go and gather, from questions somebody had to design carefully enough that the answers meant what they appeared to mean. Designing those questions is a craft with its own failure modes, and it is where the work starts.