10 Profit Reasoning
Impossible, fragile, robust — and what each one asks you to do
The previous chapter said what profit is. This one is about what to do when you compute one.
A profit figure arrives as a single number, and a single number is the least useful form the answer could take. It hides how it was produced, how close it sits to zero, and how much of it would survive being slightly wrong. Two ventures can report the same expected profit while one of them is sound and the other is standing on a knife edge.
So the object worth looking at is not the number. It is the curve.
What a Profit Curve Shows
Plot profit against price and the structure of the decision becomes visible. At low prices you sell plenty and earn too little on each. At high prices the margin looks handsome and too few people buy. Somewhere between, if anywhere, the two effects trade off in your favor.
Every curve in this chapter is a picture of one equation, and it is the one this book started with:
\[ \mathsf{\pi(p) = (p - c)\,q(p) - f} \]
The only thing added is the reminder that quantity depends on price, written \(\mathsf{q(p)}\). That small notation carries the whole first half of the book. Your demand curve is not sitting alongside your profit calculation; it is inside it, supplying the quantity at every price you might consider. Estimate demand badly and every point on the profit curve is wrong, which is why four chapters came before this one.
Reading the curve is reading that equation as a shape.
That shape carries information no summary statistic does. You can see whether profit is possible at all, over what range of prices it survives, how steeply it falls away on either side, and how far the whole curve sits above or below zero. Those are four different questions, and they have four different answers that a single number collapses into one.
The curve is a map rather than an instruction. It does not tell you what to charge. Reading one is an act of interpretation, and interpretation is the part that stays yours.
The Profit Analytics app draws these curves from your own demand estimate, cost structure, and population. It rescales demand to the population you specified, applies the commitments you named, and computes profit across every price consistently. Everything it does is arithmetic you could do by hand and would rather not. Whether the answer justifies commitment is not arithmetic, and the app has no opinion about it.
Three readings come up often enough to name. Profit can be impossible, fragile, or robust, and each one asks something different of you.
When Profit Is Impossible
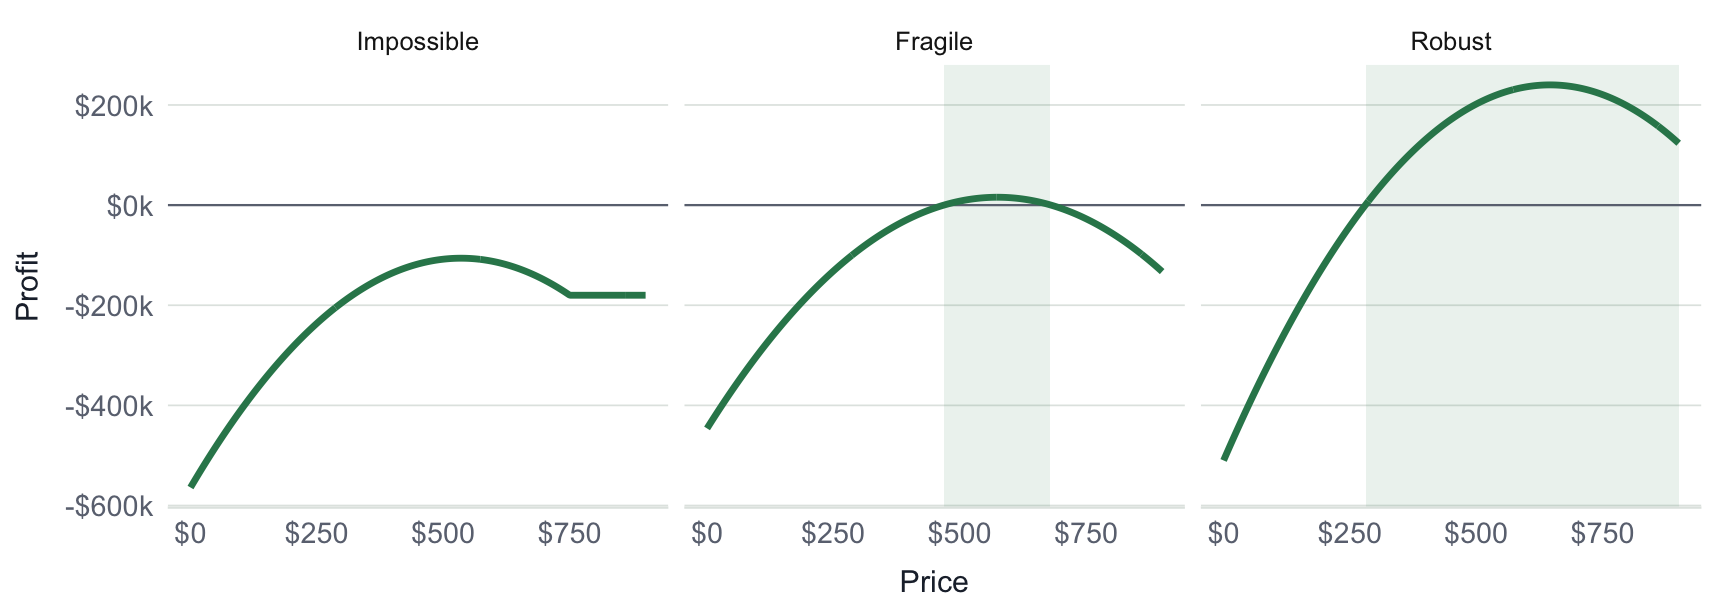
Sometimes the curve never crosses zero. Impossible profit means exactly that and no more: at every price you could charge, the venture loses money.
Impossible profit — no price covers the commitments. A statement about the current design, not a prediction about the venture.
The reflex is to assume something broke. Founders re-check the data, adjust the demand fit, hunt for a price they might have missed. Almost always the analysis is fine and is telling them something precise: given what you currently believe about demand, cost, and scale, no price supports the commitments you have named.
Read that sentence carefully, because it is narrower than it feels. It says nothing about whether the venture will fail, whether customers want the product, or whether you should quit. It is a statement about this design, and the design is made of things you chose.
The cause is almost always in one of three places. Demand may be too weak at feasible prices, because willingness to pay is low or falls away quickly as price rises. Costs may be too high for the demand you have, either because variable cost leaves too little contribution per unit or because fixed commitments are large relative to the volume anyone could plausibly deliver. Or scale may be misaligned: the demand estimate is sound at the sample level, but the population you can actually reach is too small, or the penetration required to cover the commitments is higher than anyone achieves.
Weak demand rarely shows up on its own. It matters through one of the other two, by failing to clear variable cost or by failing to reach the volume the fixed costs need. That is why the curve alone does not name the cause, and why the three have to be checked separately.
There is a temptation to look for the one number that would fix it. Impossible profit is rarely one number wrong. It is a mismatch among three things, and understanding the mismatch has to come before changing anything.
What the result invites is a specific question: what would have to change for profit to exist, and is that change available to me? Sometimes the answer is a smaller commitment, which lowers the bar. Sometimes it is a different population, one that is denser or cheaper to reach. Sometimes it is a redesigned offering with different economics. And sometimes there is no such change, and the honest move is to stop.
Finding this out before signing a lease is the whole point. An impossible curve found early costs a few weeks of analysis. Found late, it costs whatever you committed.
When Profit Is Fragile
The harder case is the one that looks like good news.
The curve crosses zero. There is a price, maybe a small band of prices, where the venture makes money. After the starkness of an impossible curve this feels like progress, and it is where founders most often overread their own analysis.
Fragility is about how much error the decision absorbs, which is a different question from whether profit is positive. A fragile curve clears zero across a narrow band and falls away steeply on both sides. Being modestly wrong about willingness to pay, or having costs run over by a tenth, or reaching fewer people than you projected, moves you off the profitable stretch entirely.
Fragility — how little error a decision tolerates before it reverses. A narrow profitable band with steep sides, regardless of how high the peak is.
None of those errors is exotic. Demand estimates are imperfect by construction, costs move, and access erodes. A structure that only works when nothing goes wrong is a structure that does not work, because something always goes wrong.
Fragility arrives from two directions that look different and behave the same. Thin demand with light commitments produces a small, shallow profit that any disappointment erases. Strong demand with heavy commitments produces a larger profit that exists only if the volume materializes. The first is a business too small to survive its own variance; the second is a business that has bet on its own forecast.
Fragile profit is more dangerous than impossible profit for a plain reason. Impossible is unambiguous and forces a decision. Fragile offers a plausible story of success, and a plausible story is exactly what a founder who has already decided will reach for. A single positive region on the curve gets read as validation when it may be a knife edge.
The instinct fragility triggers is to optimize — profit is positive somewhere, so find the best price. Optimization sharpens the edge without widening it. Before asking where profit is highest, the question worth asking is whether profit exists across a wide enough range of beliefs to justify committing, which is a question about robustness.
Fragility is sometimes fixable. Delaying a fixed commitment lowers the bar the venture has to clear. Converting a fixed cost to a variable one trades peak profit for a wider profitable band. Narrowing to a denser, more reachable population raises achievable penetration. Each of those widens the band rather than raising the peak, which is the right trade when the band is what is threatening you.
And sometimes fragility is simply the answer: the venture is too exposed to commit to yet.
When Profit Is Robust
The third reading is the one worth waiting for. Robustness is profit that clears zero across a wide range of prices, with the curve shallow near your candidate price, so that being somewhat wrong about several things at once still leaves you in the money.
Robustness — whether a decision stays acceptable when demand, cost, access, and execution all come in somewhat worse than planned.
Robustness is worth more than maximum profit, and the trade is usually available. A design with a slightly lower peak that survives a bad quarter dominates a higher peak that reverses on a mild disappointment. Founders reliably choose the higher peak, because peaks are what spreadsheets report and bands are what you have to go looking for.
A robust curve is not permission to stop thinking. It says the structure tolerates error, which is a claim conditional on the same assumptions everything else rests on. If your population estimate is wrong by an order of magnitude, the robustness was computed on a fiction. Robustness is a property of the model, and the model is only as good as what went into it.
What robustness does buy is the right to commit deliberately. That is the point of the whole exercise.
Which Assumption to Learn Next
Profit reasoning has one more use, and it is the one most often skipped. It tells you what to go find out.
Every profit estimate rests on beliefs: how demand responds to price, what a unit costs to deliver, how many people you can reach, what fraction of them will say yes. Vary one of those and watch what profit does. Sensitivity is how much the answer moves when a belief moves, and it sorts your beliefs by how much they matter.
Sensitivity — how far profit moves when one belief moves. A ranking of which assumptions carry the decision, not a ranking of which are likely wrong.
Sensitivity is about consequence rather than likelihood. An assumption you are fairly confident about still deserves attention if being wrong about it reverses the decision. An assumption you are quite unsure of may not matter at all, because profit barely responds to it. Confidence and consequence are independent, and only one of them is about the decision.
That ranking is where most treatments stop, and stopping there produces bad priorities. The most sensitive assumption is not automatically the one to work on, because some assumptions cannot be moved. National fuel prices may dominate your cost structure and there is nothing you can do about them. What you want is the assumption that is both consequential and actionable — one you could test with a survey, influence by design, delay until you know more, or shift onto somebody else through a contract.
Sort by that pair and the next move usually names itself. A consequential assumption you can cheaply test is your next experiment. A consequential assumption you can design around is a change to the offering. A consequential assumption you can neither test nor influence is exposure, and the only decisions available are to accept it, hedge it, or decline.
This is what makes sensitivity a learning tool rather than a reporting tool. Time and attention are the scarcest things a founder has. Sensitivity tells you where to spend them, which is a better use of a profit model than computing a more precise number.
It also reframes what scale means. Some ventures are deliberately built to run on very low commitments early, and that is a strategy rather than a shortcut. For those, the question is not whether the design supports the full commitment eventually, but whether it can sustain itself at this stage long enough to earn the right to the next one. Scale becomes a path with stages rather than a single number to clear, and sensitivity tells you what each stage can survive and what would break first.
Before you accept a profit curve
The app will hand you a curve, a peak, and the price that produced it. Do not accept any of them until you can answer four questions.
- Which reading is this? Say it in one word — impossible, fragile, or robust — and say what in the curve tells you.
- How wide is the band? Name the lowest and highest price that still clears zero. If those two numbers sit close together you have fragile profit, however large the peak between them is.
- Which assumption carries the decision? Move one belief at a time until profit crosses zero. Whichever one gets there on the smallest change is the one the decision is resting on.
- Can you do anything about that assumption? If you can test it, that is your next piece of work. If you can neither test it nor design around it, that is exposure, and it has to be accepted deliberately rather than discovered later.
If you cannot answer all four, what you have is a number rather than a decision.
Seeing It Move
The three readings are easier to believe when you can push a structure from one to another. Below is the profit curve for a venture whose demand, unit cost, and commitment you control.
The three sliders are the three terms of the equation. Market size sets \(\mathsf{q(p)}\), how many buyers exist at each price. Unit cost is \(\mathsf{c}\). Commitment is \(\mathsf{f}\). Everything you can change about this venture is one of those three, and the curve is what they produce together.
Start by lowering the market size. The curve sinks bodily until no price clears zero, which is the scale cause of impossible profit — the demand shape is unchanged and there are simply not enough buyers to carry the commitment.
Put it back and raise the unit cost instead. The curve flattens and drops as contribution per unit disappears. That is the cost cause, and it behaves differently: raising price no longer helps, because the problem travels with every unit you sell.
Now watch the commitment, which is the slider worth spending time on. Raising \(\mathsf{f}\) shifts the whole curve down without changing its shape at all, narrowing the profitable band from both ends at once. The starting position sits deliberately on a boundary: one step down and the reading turns robust, two steps up and profit is gone entirely. A thirty-thousand-dollar decision moves this venture across all three readings.
Nothing about your customers changed while you did that. Their willingness to pay is identical at every price. You simply raised the bar they have to clear, and at some point on that slider you raised it past them.
Is This Worth Doing?
By this point the analysis has done what it can for a venture considered on its own. Demand was learned from evidence rather than assumed. Costs were treated as commitments you chose. Scale was made explicit instead of imagined. Profit has been examined for whether it exists, how much error it survives, and which belief it depends on.
What none of it has done is put a rival in the room, and a rival reaches into the price you were treating as yours. That is the subject of the rest of the book, and it changes what the arithmetic is worth rather than how it is done.
What is left, for a venture standing alone, is a judgment, and it belongs to you.
The question is not whether the venture will succeed, whether the idea is exciting, or whether the number came out as high as possible. Stated precisely, it is this: given what we now know about demand, cost, and scale, is there a path to profit that survives being somewhat wrong, and am I willing to commit to it?
Notice that both halves are required. The first is analytical and this book has spent ten chapters on it. The second is not analytical at all. Two founders can read the same robust curve and reasonably disagree about whether to proceed, because they are exposed differently, have different alternatives, and can absorb different losses. Nothing in the arithmetic settles that, and a model that claimed to would be lying.
What profit reasoning does is narrow the space of responsible choices. It tells you when the design cannot work and must change, when profit exists but is too thin to commit against, and when the structure is sound enough to proceed deliberately. That is genuine progress even when the answer is not yet or not like this.
Commitment is what makes this decision different from the ones before it. Prices can be changed, experiments rerun, prototypes rebuilt. Fixed costs, leases, hiring, and inventory convert uncertainty into exposure, and they do not convert back. That asymmetry is the reason the profit question belongs here, before the commitments, rather than after them where it becomes a postmortem.
Choosing to proceed does not make the uncertainty go away. Demand may disappoint, costs may rise, access may take longer than you planned. The goal was never to eliminate those risks. It was to make sure that when you accept them, you know what you are accepting and roughly how much of it there is.
Choosing not to proceed is not a failure of nerve, and it is certainly not a failure of the analysis. It is learning having done its job before the money was spent.
Ask yourself — what would have to be true?
Take your current profit estimate and write down the single number it depends on most. Not the profit figure. The belief underneath it — the willingness to pay you assumed, the population you counted, the unit cost you projected.
Now move it in the direction you would least like. Ten percent worse. Does the decision change?
If it does, you have found what your venture rests on, and you now know what to go and learn before you commit. If it does not, move it further, or move a different one, until something breaks. Everything breaks somewhere. The question is only whether it breaks inside the range of things that could plausibly happen to you.
Then ask the harder half: can you do anything about the belief you found? If you can test it, test it. If you can design around it, redesign. If you can do neither, you have located your exposure, and the decision to accept it should be made out loud rather than by default.
The move: Read the band, not the peak. A profit curve that clears zero across a wide range of prices is worth more than a higher one that clears it briefly, because you will be wrong about something and only the wide one survives it.